Oil Palm Stem Disease Detection
Try out the prediction in this web app.
Introduction
This is my undergraduate thesis research project. The goal is to create machine learning that can identify if the oil palm stem is infected from a stem image. To accomplish this, the first step is to extract features from the image and then classify them. I utilize a pre-trained Convolutional Neural Network (CNN) to extract the features, followed by Support Vector Machine (SVM) to classify them.
Feature Extraction
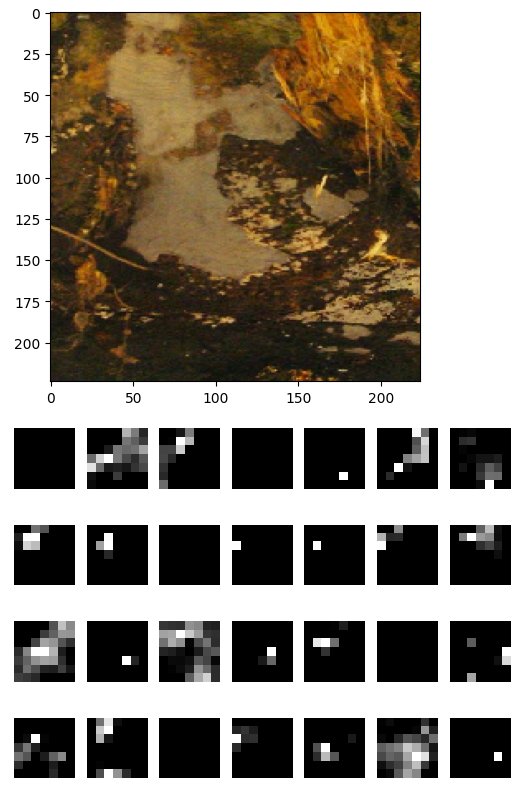
For image feature extraction, I use ResNet50, a pre-trained CNN model that has been extensively trained on a large dataset. For image feature extraction, I use ResNet50, a pre-trained CNN model that has been extensively trained on a large dataset. This allows it to effectively extract features from images. To extract the necessary features, I use the model without the top layer since I do not require classification. The final output is a set of 2048 feature maps, each with dimensions of 7x7 pixels, which correspond to the last layer of ResNet50. An example of these extracted features can be seen below, using an image of a stem.
Take the average value of each feature map by applying Global Average Pooling to result in 2048 features.
import tensorflow as tf
import numpy as np

base_model = ResNet50(weights='imagenet', include_top=False)
avg = tf.keras.layers.GlobalAveragePooling2D()(base_model.output)
model = tf.keras.models.Model(inputs=base_model.input, outputs=avg)
feature_maps = base_model.predict(np.array([image]))
Do this for all the images in the dataset, and we get a matrix of features. The matrix has a shape of (n, 2048) where n is the number of images in the dataset.
Hyperparameter Tuning and Classification
Hyperparameter tuning is done to find the ideal penalty parameter C in SVM. I used a logarithmic scale for the range values which were [0.001, 0.01, 0.1, 1, 10, 100, 1000]. However, prior to that, I performed feature selection using SelectFromModel. This feature selection used the coefficient value of all features from the SVM model.
To ensure feature selection occurs during hyperparameter tuning, I utilize a Pipeline. The Pipeline conducts feature selection initially, followed by hyperparameter tuning.
from sklearn.pipeline import make_pipeline
from sklearn.svm import SVC
from sklearn.feature_selection import SelectFromModel
from sklearn.model_selection import cross_validate

svc_C = [0.001, 0.01, 0.1, 1, 10, 100, 1000]
METRICS = ['f1', 'recall', 'precision', 'accuracy']
cv_results = []

for c in svc_C:
    svm = SVC(kernel='linear', C=c, random_state=42)
    selector = SelectFromModel(svm)
    pipeline = make_pipeline(selector, svm)
    cv_result = cross_validate(pipeline, X_train, y_train, cv=5, scoring=METRICS)
    cv_results.append(cv_result)
    print('C =', c)
    print('-------------------------\n')
Notice I instantiate the SVM in every iteration with different C value. This is because the SelectFromModel feature selection depends on the SVM model. And here is the result.
| C | mean_fit_time | mean_test_f1 | mean_test_recall | mean_test_precision | mean_test_accuracy |
|---|---|---|---|---|---|
| 0.001 | 0.766599 | 0.833192 | 0.840148 | 0.827265 | 0.831875 |
| 0.01 | 0.690000 | 0.841881 | 0.842694 | 0.842696 | 0.841875 |
| 0.1 | 0.699600 | 0.818564 | 0.813960 | 0.823547 | 0.819375 |
| 1 | 0.744800 | 0.821986 | 0.818936 | 0.825668 | 0.822500 |
| 10 | 0.715400 | 0.821986 | 0.818936 | 0.825668 | 0.822500 |
| 100 | 0.726600 | 0.821986 | 0.818936 | 0.825668 | 0.822500 |
| 1000 | 0.709000 | 0.821986 | 0.818936 | 0.825668 | 0.822500 |
The top outcome is attained by using a C value of 0.01 resulting in a score of 0.84 across all metrics. I will employ this value to retrain the pipeline on the entire training set. The feature selection resulting 813 features.
Evaluation
Before tuning the model parameters, I divided the dataset into two sets: training and testing. The training set includes 80% of the data, while the testing set includes the remaining 20%. The training set is utilized to train the pipeline, and the testing set is applied to evaluate it. The test set’s confusion matrix is displayed below.
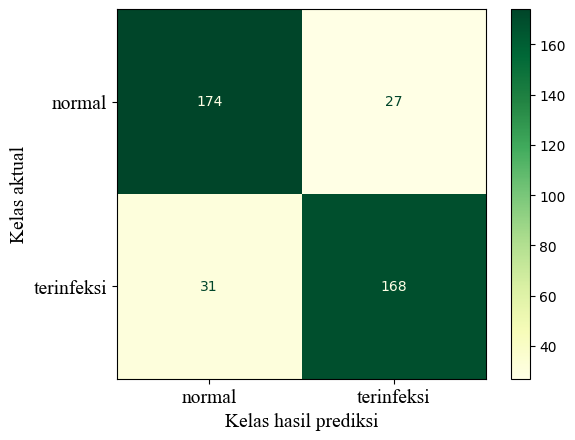
The infected (terinfeksi) stem is considered the positive class. The model achieved an accuracy rate of 85.5%, precision rate of 86.15%, recall rate of 84.42%, and an F1-Score of 85.28%, all of which are impressive. Notably, the precision rate is higher than the recall rate, indicating that the model is cautious when predicting infected status. This could be useful to farmers who choose to keep infected stems.
Conclusion
In this project, I created a machine learning model that can classify whether the oil palm stem is infected from the image of the stem. The program is accurate 85.5% of the time, with a precision of 86.15%, recall of 84.42%, and F1-Score of 85.28%. The model can be used to help farmers detect the disease early and prevent the spread of the disease.
Checkout the entire notebook in this repo.